Basics
This is the first diagram we will make together. This is the equivalent of the print("Hello World") program for Penrose. To make any mathematical diagram, we first need to visualize some shapes that we want. In this tutorial, we will learn about how to build a triple (.domain, .substance, .style) for a simple diagram containing two circles.
👉 Open this online workspace in a separate tab to follow along!
Goal

This is what you will achieve at the end of this tutorial. If you are familiar with set theory you may recognize that circles are commonly used to represent sets, and that's exactly what we have here. We have 2 sets without names (we will get to labeling later 😬).
📄 Domain
It follows naturally that our mathematical domain is Set Theory. Let's take a look at our .domain file.
Recall that a .domain file defines the possible types of objects in our domain. Essentially, we are teaching Penrose the necessary vocabulary that we use to communicate our concept. For example, recall our example of a house from the introduction. Penrose has no idea that there are objects of type "plant" or "furniture" in a house, but we can describe them to Penrose using the type keyword.
- We declare a new type following the syntax of
type TYPE_NAME.
For example, if we want Penrose to know that there are objects of type plant, we would do type Plant or type plant. We normally capitalize type names.
❓ What's the most fundamental type of element in Set Theory? (hint: the name gives it away.)
The answer is a Set. A set is a type of element in set theory. Therefore in our .domain, we write the following line:
type SetAnd that is all we need for this exercise in .domain 🎉. Now Penrose knows that there are objects of type Set.
If you look closely at the repository, we have a domain file that contains more extensive operations common in Set Theory such as Intersection, Union, Subset, and more.
📄 Substance
Since we are visualizing 2 sets, they are substances of this diagram. These go in our .substance file.
We declare a substance by first declaring its type followed by its name. The name will not appear in the diagram unless you choose to label your substances, therefore in this exercise, it doesn't matter how you name your sets.
Set A
Set B
Now, Penrose will know that you want two substances of type Set in your diagram. 🎉
Here we have capitalized Set because we did so in our .domain file. If we had writtentype set instead, we would declare our set with set A here. There is no magic here, you define your Penrose world completely. 🌎✨
📄 Style
For style, we have a little more work to do. If you are familiar with HTML/CSS, a .style file is essentially a .css file for your HTML (which would be our .substance file).
We first need to specify the dimensions of the canvas that our diagram will be drawn on. To do so, you can write the following code anywhere in .style. We recommend using a canvas size of 800x700.
canvas {
  width = -- [some width]
  height = -- [some height]
}
Now, Penrose does not know a set is commonly represented as a circle. We need to style our elements from scratch. This might seem strange, but this way you are given absolute freedom in how you want to represent your substances in the diagram. Your set doesn't have to be a circle, it could be a square, a rectangle, etc. But for this example, we will be representing sets as circles.
The syntax for declaring styles is as follows:
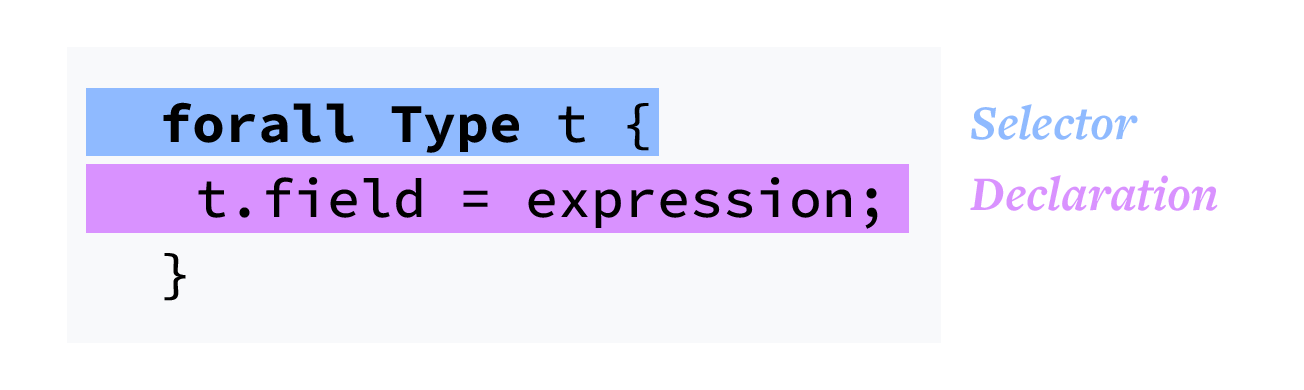
Note that the syntax is very similar to the mathematical way of talking about objects, so it should be pretty natural for people with some background in math. If you don't, that's completely fine too! You can interpret the syntax this way: we go through the substances in the diagram, and for all the substances of type Type that we see, we apply the same styling as defined in the { }.
In this case, our Type is Set, and we want all of our sets to be circles. We can make that happen by setting some field of each set to a Shape object. In the example below, we name the field .icon. It could be named whatever you want, .foo, .shape, even .ImALittleTeapot would work, as long as we are assigning it to a Shape object. Penrose will detect the Shape object and use it to render each Set as that object.
forall Set x {
    x.icon = -- [some shape object]
}
So, what are the shapes we can use? Currently, the system supports 12 different shapes, and you can find the specs for every shape here. It is a page that you will visit frequently as you work in Penrose.
This is the specification for the shape Circle, and all the other shapes we have available are documented in the same way. You can see a table that lists out the different properties you can manipulate, along with the default values for any properties that aren't randomly generated.
When we construct the Circle object for our Set, we need to look back at our goal diagram. Our desired circles do not have strokes, therefore we will set strokeWidth : 0.0. (Actually, we could leave that out as well, because it is the default for strokeWidth in Circle.) For all the other properties that we did not specify, Penrose will choose the best value for them based on optimization, so you do not have to worry.
forall Set x {
    x.icon =  Circle {
        strokeWidth : 0.0
    }
}
And that's a wrap! 🎉
🏗️ Compile
Now it's time to see all of our hard work (drumroll please 🥁)!
Click the Compile button.
Exercise
We have now covered the differences between and usage of the .domain, .substance and style files. We have provided 3 exercises for you to help solidify the basics. You can work on each of these within the existing files - no need to make new ones. Hint: Make use of the shape specs here.
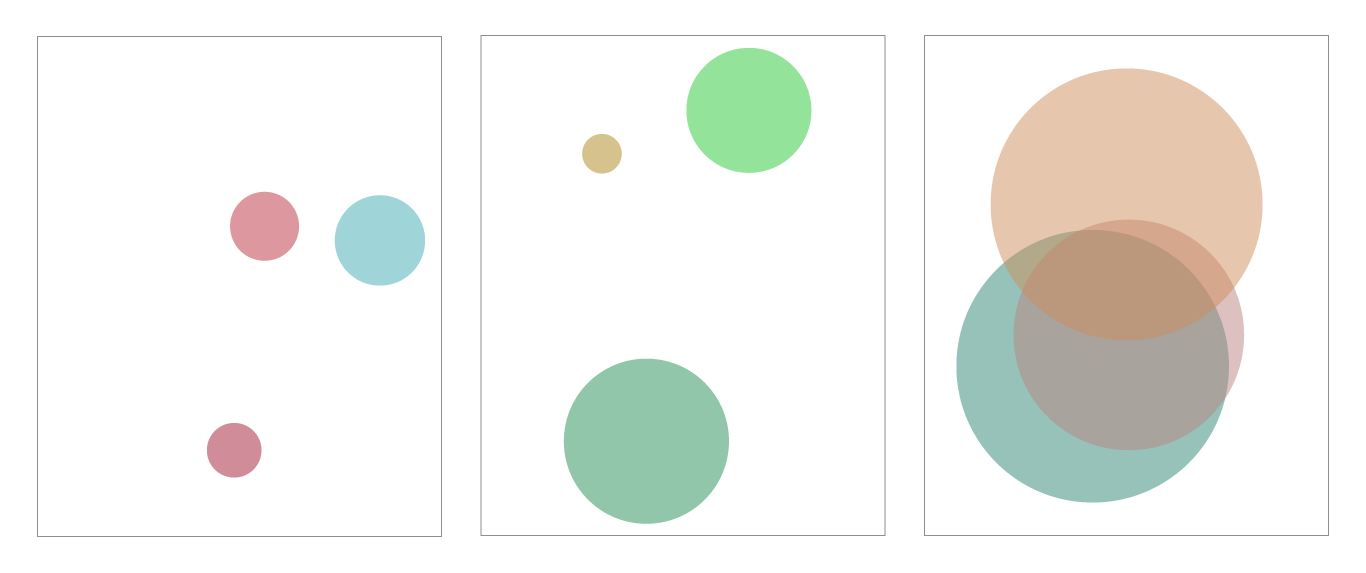
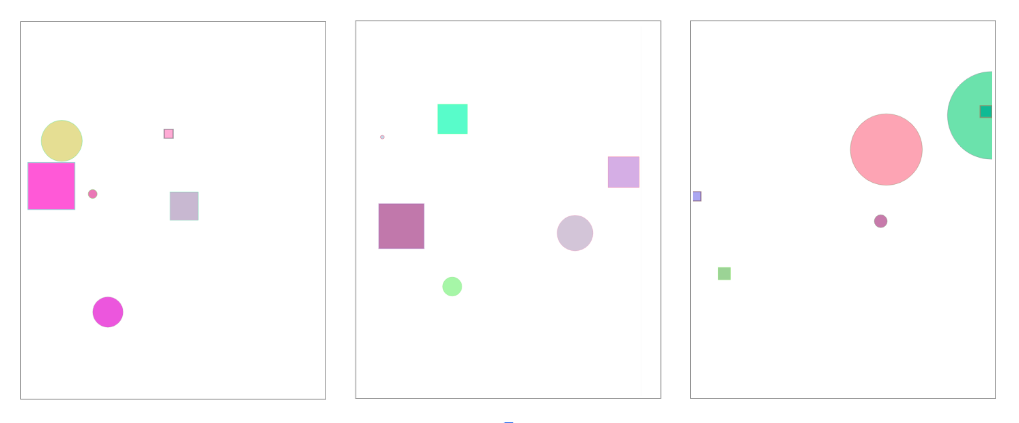
Since we are not defining all the properties that control how the shape will look on-screen (location, color, etc), Penrose will optimize and make those decisions for you. Therefore when you click the resample button, you will get a new diagram that might have varying appearances, and here we've provided some sample results of the same Penrose program. So do not worry if your diagram does not look the exact same as ours.
- Challenge 1: Add another
Setto the diagram.
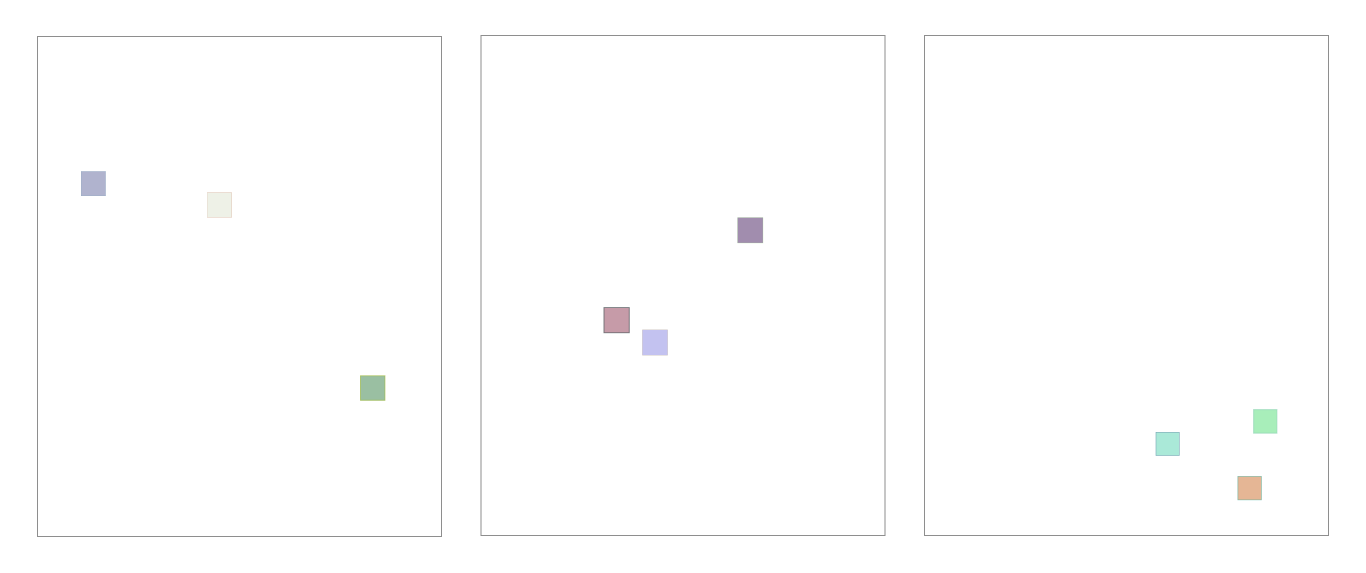
- Challenge 2: Keep 3 sets. Represent
Setas squares with side length equal to50.0. (Hint: there is noSquaretype, but you don't need one.)
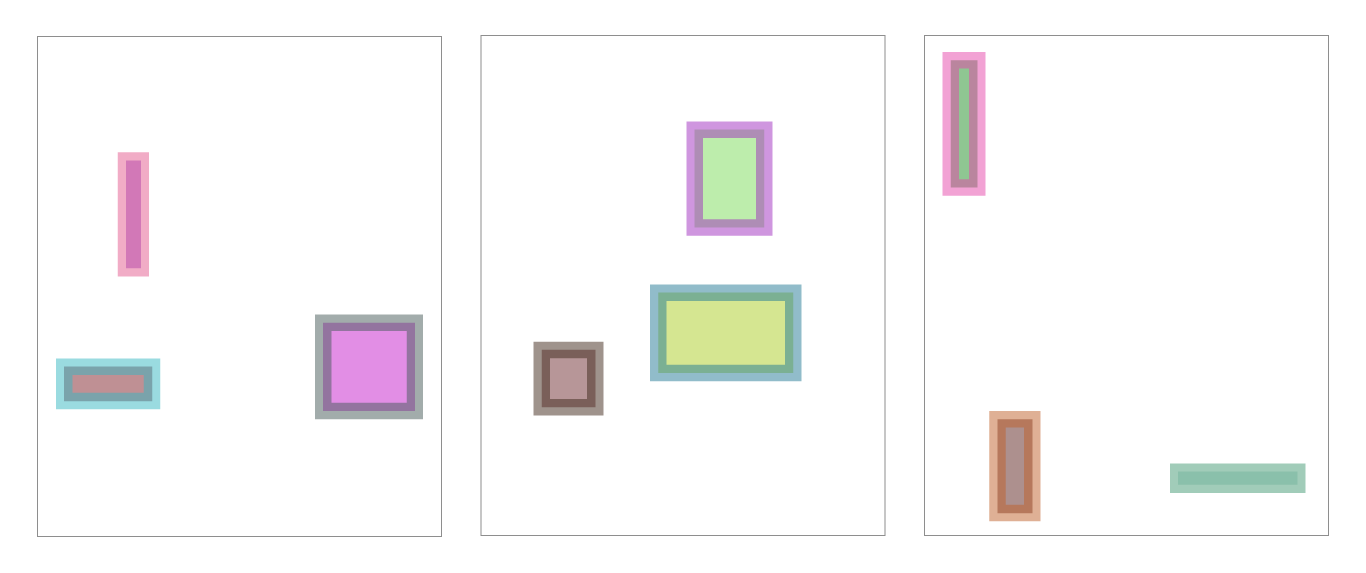
- Challenge 3: Keep 3 sets. Represent
Setas rectangles withstrokeWidthequal to 15. (Hint: you'll also want to setstrokeColortosampleColor(0.5, "rgb")or similar.)
- Challenge 4: Keep 3 sets. For each set, represent
Setas both aCircleand a square. There should be 6 objects on your canvas. (Hint: you will need to initialize another Shape object!)
After you are done, you can double-check your work with the sample solutions.
Takeaways
- For each Penrose diagram, we need three files.
.domainfile which defines the domain..substancefile which defines the substances of the particular diagram..stylefile which defines how we want to visually represent the mathematical objects.
- We define a type of object in our domain with the pattern
type TYPE_NAMEin our.domain. - We define the substances in our diagram by declaring their type and variable name in our
.substance. - We define the styles using the syntax
forall TYPE_NAME x { /* declarations */ }in our.style.
Now we are going to start the second tutorial that teaches a set of new skills which will allow you to create more intricate and complex diagrams with Penrose. Take a stretch or a little walk, you're about to be one step closer to being a Penrose expert! 😄