Welcome!
We are so glad you are here.
Ready to make some beautiful diagrams? Penrose is accessible to people coming from a variety of backgrounds including mathematical domain experts and individuals with no programming experience.
Table of Contents
In this section, we will introduce Penrose's general approach and system, talk about how to approach diagramming, and explain what makes up a Penrose diagram.
The real fun begins when you dive into the series of tutorials we have prepared for you. You can navigate through tutorials using the navigation bar on the left, and jump between sections of a single page using the navigation bar on the right.
Note that each tutorial builds on top of the last, so we highly recommend that you work through the tutorials in order. Each one contains a detailed walk-through of a particular example and several exercises for you to consolidate your knowledge.
Introduction
This section provides both concrete and conceptual descriptions of how to work within the Penrose environment. Feel free to dive into the tutorials if you are ready.
How do we create diagrams by hand?
Recall how you would normally create a diagram of a concept using a pen or pencil. It will most likely involve the following steps:
1. Decide what you are diagramming
- Let's say we are making a diagram of things in your house. Then the domain of objects that we are working with includes everything that is in your house. Subsequently, any items that can be found in your house (furniture, plants, utensils, etc.) can be thought of as specific types of objects in your household domain.
2. Make a list of the objects you want to include in the diagram
- We either write down or mentally construct a list of all the objects that will be included in our diagram. In Penrose terms, these objects are considered substances of our diagram.
- For example, your chair 🪑 is a particular instance of an object in the house domain 🏠. If the chair is in the diagram, then it is a substance of the diagram.
3. Figure out the relationships between the objects
- If we only put the list of items on paper one by one, that would not be a particularly interesting or useful diagram. Diagrams are more interesting when they visualize relationships.
- For example, we could group the plants in your house based on the number of times they need to be watered on a weekly basis. Then we would have visual clusters of elements.
4. Explore different visual styles
- Drawings commonly require explorations and various attempts with colors, sizes, and compositions. The same concept can be visualized in a number of different styles.
The process of creating a Penrose diagram is similar to our intuitive process of analog diagramming. 🎉
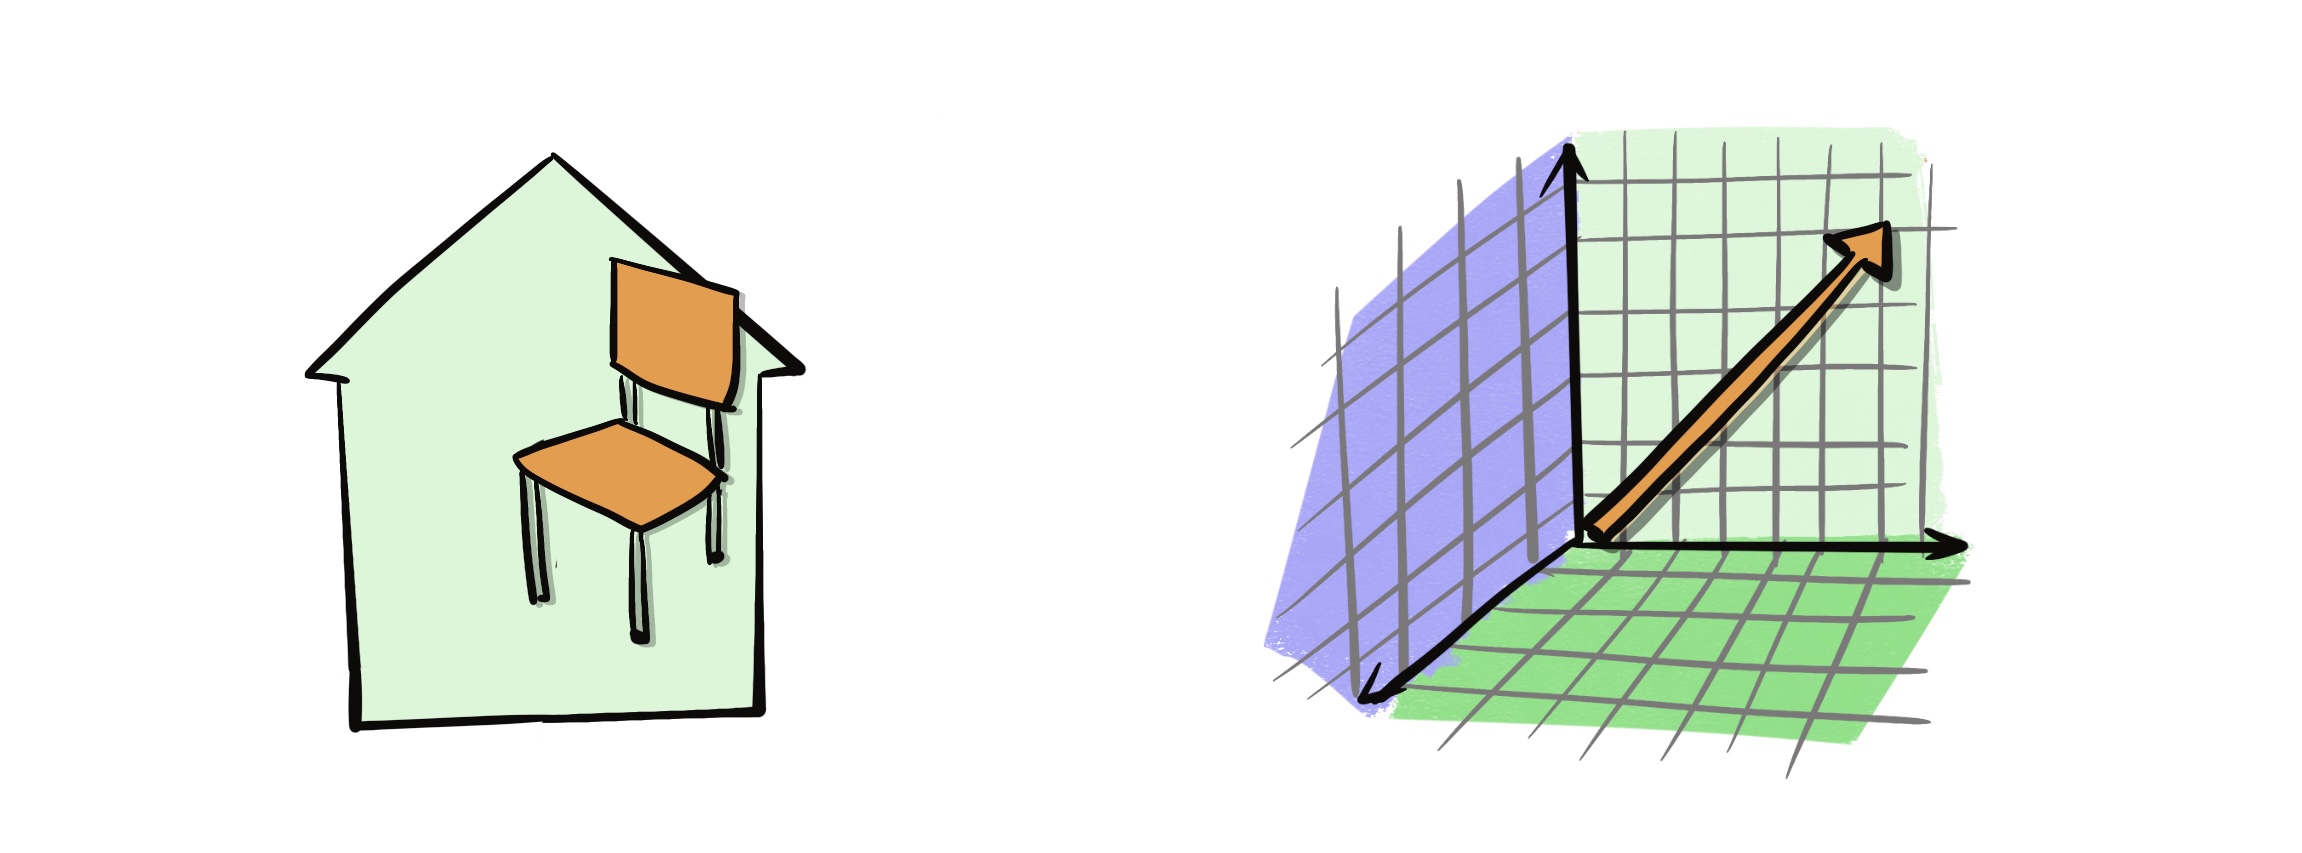
Let's circle back to what Penrose is meant to do: create beautiful diagrams from mathematical statements. If a chair is an object within a house, then it follows that a vector is also an object within Linear Algebra. With Penrose, you can build any mathematical domain with concepts that you wish to visualize. 🖌️
What makes up a Penrose program?
As discussed above, it is important to keep track of any objects that we want to include in our Penrose diagram. The way we do that is by writing code in three specific files.
- First, we need to define our domain of objects because Penrose does not know what is in your house or what a chair is. In addition to defining the types of objects in your domain, you will need to describe the possible operations in your domain. For example, you can push a chair, or sit on a chair, which are operations related to a chair.
- Second, we need to store the specific substances we want to include in our diagrams, so Penrose knows exactly what to draw for you.
- Lastly, we need to define the styles that we want to visualize our substances with.
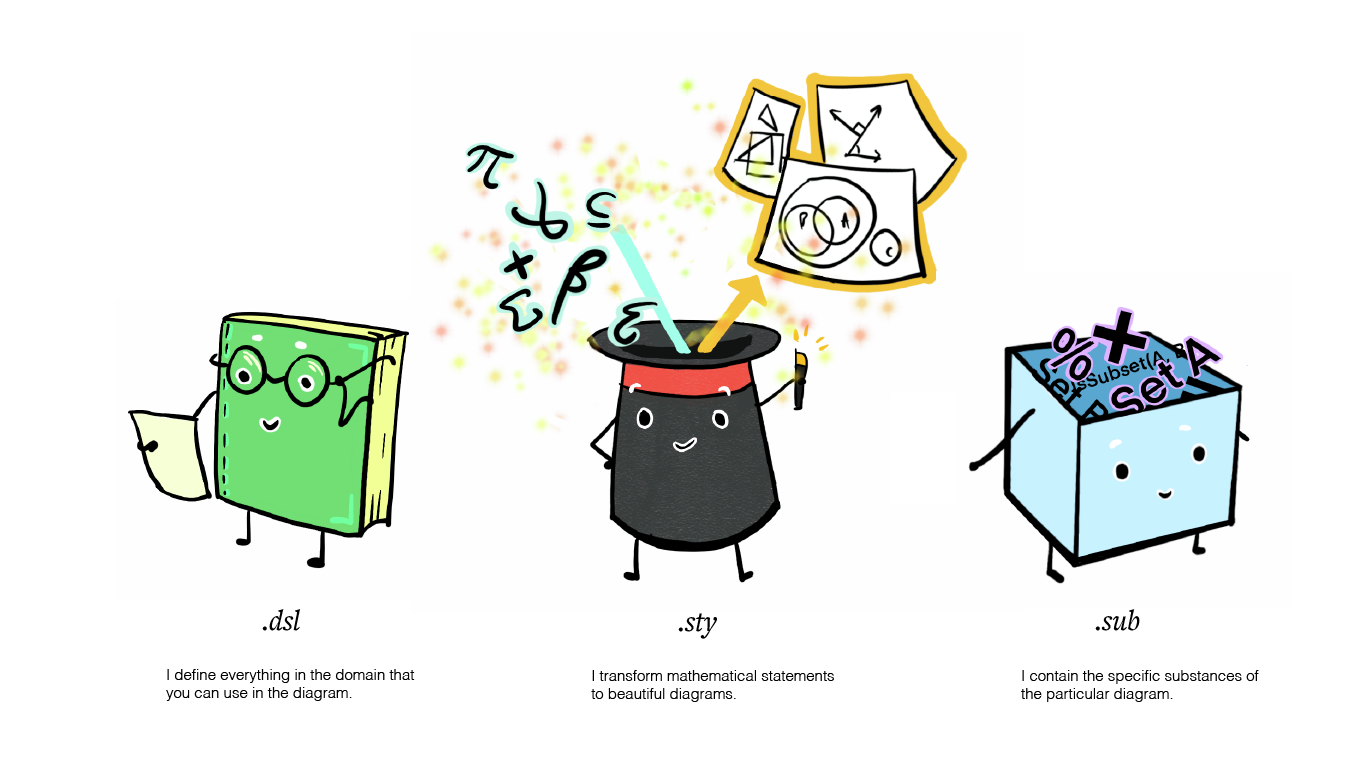
Each of these corresponds to a specific file with an intuitive file extension designed for accessibility:
- A
.domainfile that defines the language specific to the domain. - A
.substancefile that creates substances of mathematical content. - A
.stylefile that specifies the style of the visual representation.
In general, for each diagram, you will have a unique .substance file that contains the specific instances for the diagram, while the .domain and .style files can be applied to a number of different diagrams. For example, we could make several diagrams in the domain of Linear Algebra that each visualize different concepts with different .substance files, but we would preserve a main linearAlgebra.domain file that describes the types and operations that are possible in Linear Algebra, and select from any of several possible linearAlgebra.style files to affect each diagram's appearance.
Now, you are equipped to embark on your Penrose journey and make your first Penrose diagram! Here's a quick sneak peek of what we will be building in the following tutorials:
Sneak peek of the tutorials
- Tutorial 1: Diagram containing 2 sets

- Tutorial 2: Diagram illustrating the concept of
subset

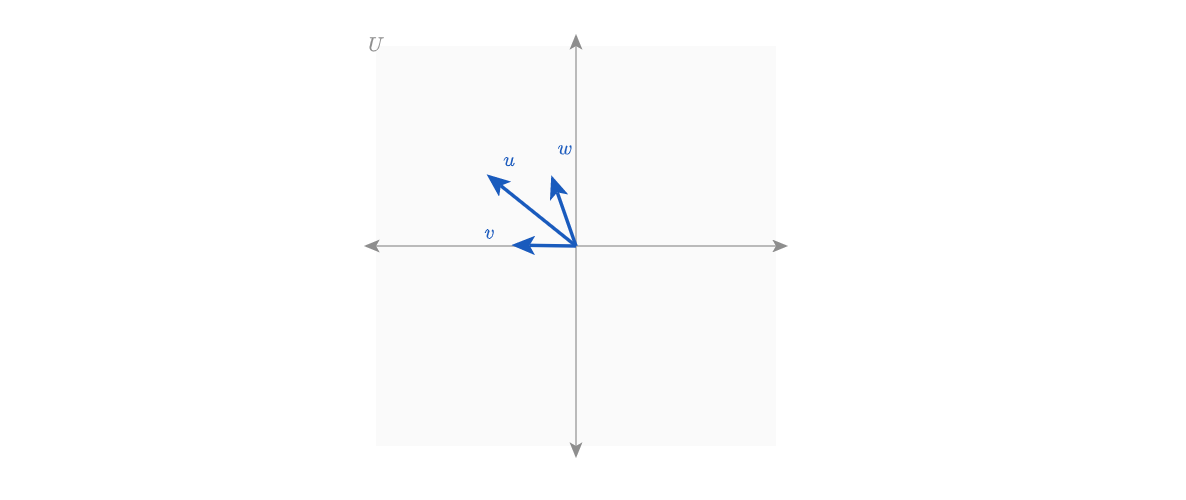
- Tutorial 3: Diagram showing vector addition