Using Penrose
Use our online editor to start making diagrams in your browser now. To make diagrams locally, use roger, the command-line interface for Penrose.
Online editor
You can start creating diagrams by visiting the online editor.
Examples
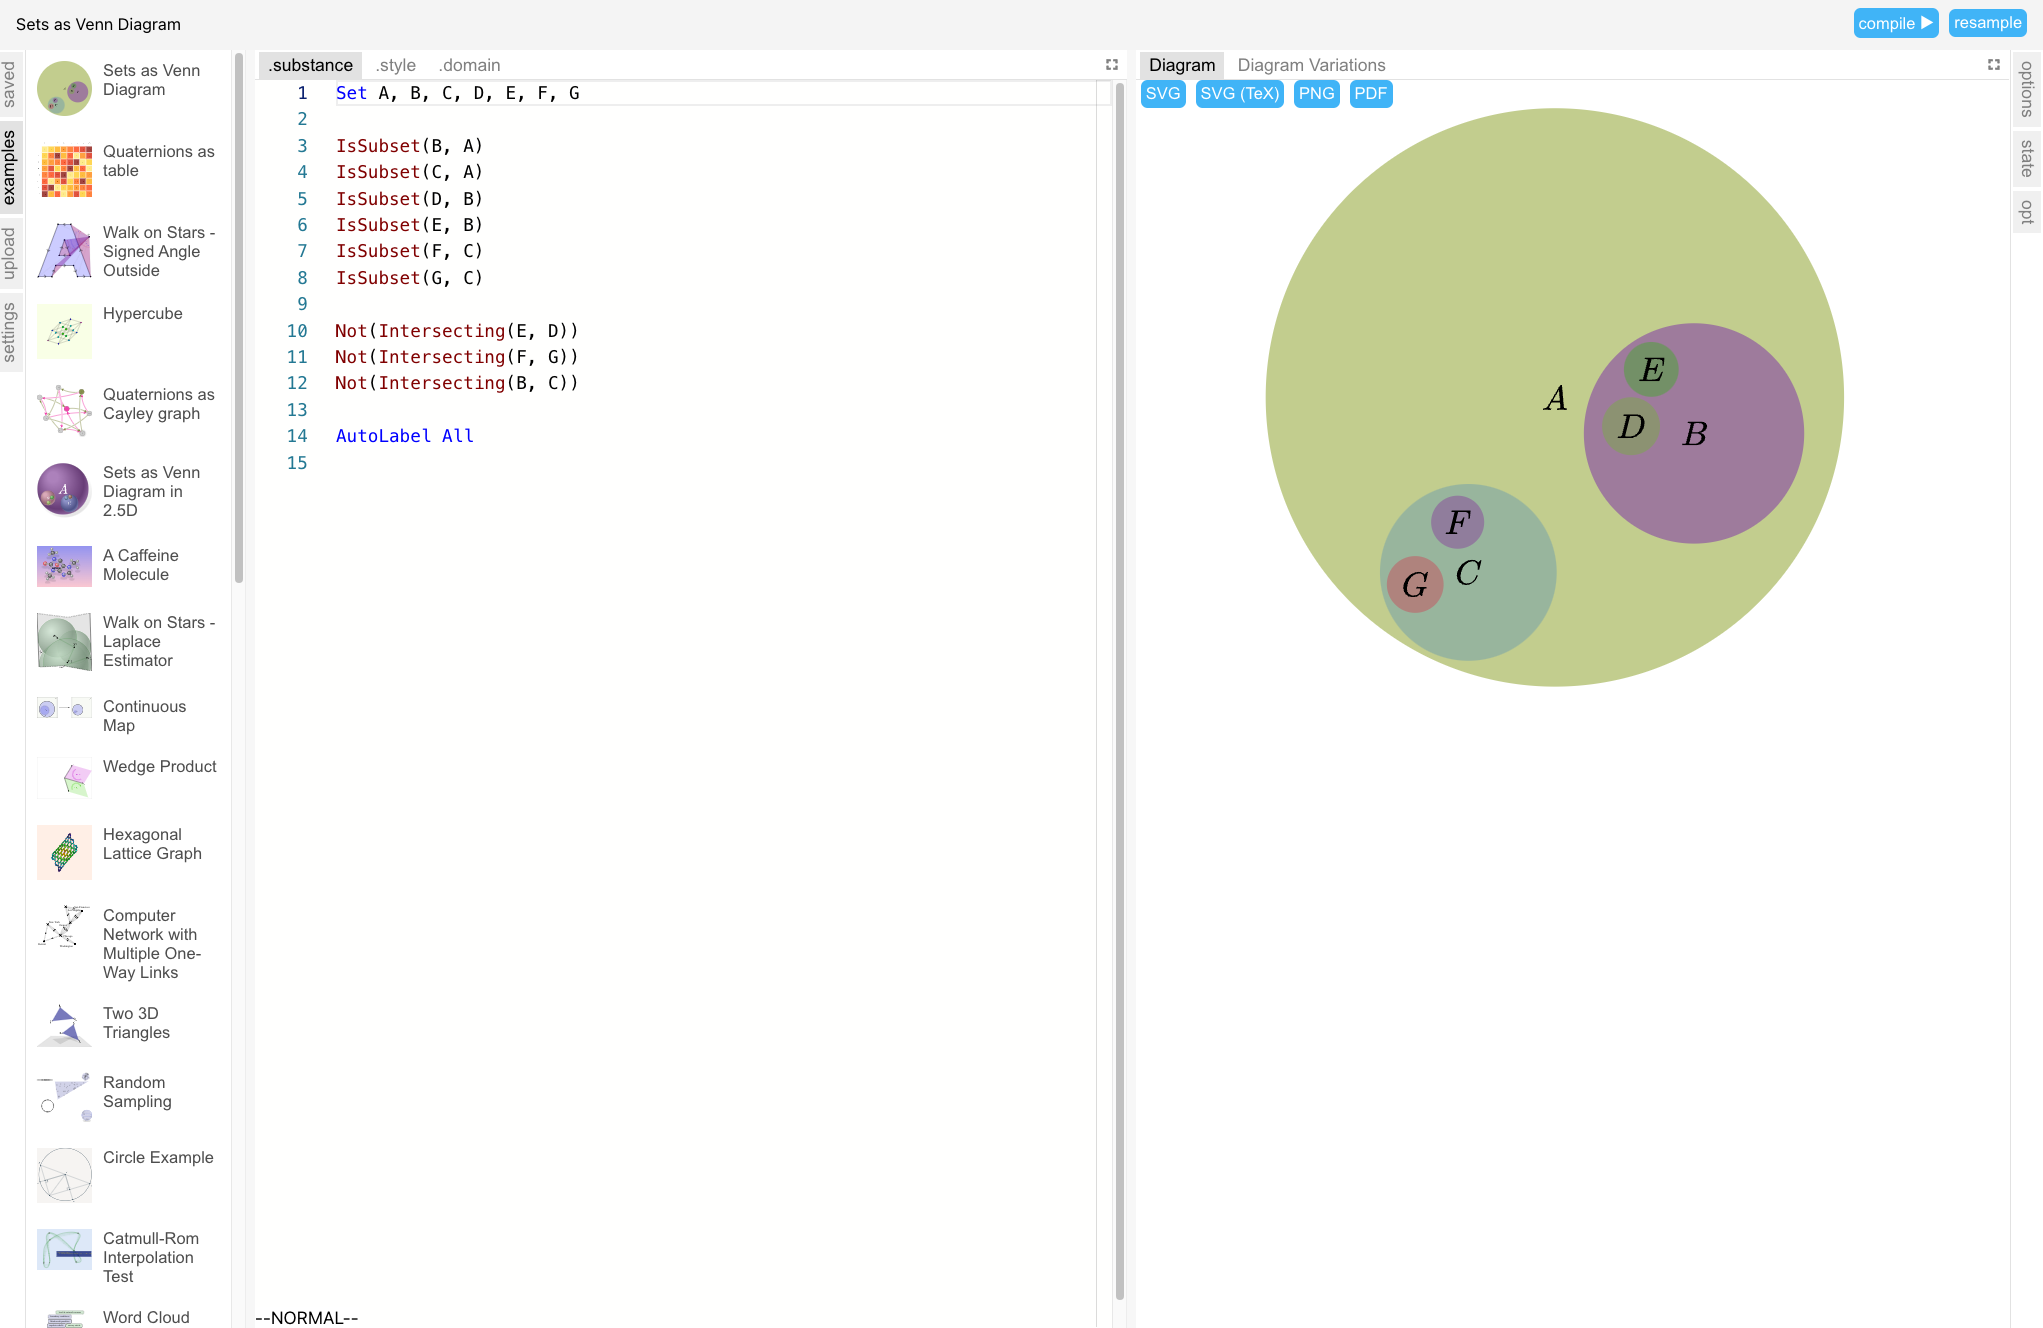
You can either start with an empty workspace or load any of our gallery examples by selecting diagrams in the "example" tab.
Editing
Start editing in the ".substance," ".style," and ".domain" tabs and hit "compile ▶" to view the diagram in the "Diagram" panel. If there are any errors, they will be displayed in the "Diagram" panel and inline in the editor panels. To view another layout of the diagram, click "resample."
You can also see multiple alternate layouts by switching to the "Diagram Variations" panel.
Save
When you are editing the diagram, click "Save" anytime to save your progress in local storage. After you save a diagram, it will appear under the "saved" tab, and the editor also periodically auto-save your progress going forward.
Share
You can share a saved diagram via GitHub Gist. This requires you to sign into GitHub by clicking "sign into GitHub" under the "settings" tab. After that, click "share" in the navigation bar to create a gist. The editor will redirect you to a sharable link. Copy the link to share with others.
Export
We current support four export formats:
- PNG
- SVG
- SVG for LaTeX: by default,
Equationlabels are rendered as embedded SVGs. When using a Penrose-generated diagram in LaTeX, you may want to customize these labels so their styling is consistent with the rest of the document. The "SVG (TeX)" option exportsEquationas raw texts, and you can customize the styling in LaTeX by importing the SVG using thesvgTeX package. Check out Keenan Crane illustrated tutorial of the walk on stars (WoSt) algorithm for an end-to-end example.
SVG Upload
SVGs exported by the editor contain necessary metadata (e.g. source trio programs) for the editor to re-load them into the workspace. After exporting a diagram to SVG, you can also drag-and-drop the SVG under the "upload" tab to resume editing.
Advanced
Toggle "vim mode" under the "settings" to enable vim keybindings. Toggle "debug mode" to enable advanced features for debugging:
- "options" include layout settings:
- Variation: each diagram layout is uniquely identified by a single variation string. Changing this string generates another layout alternative (similar to clicking "resample").
- Step size: number of steps the layout engine takes per frame. The default is a high number so the diagram will show up instantly. To animate the layout process, try a lower number like
50. - Autostep and step: when turned on, "autostep" tells the layout engine to keep going until layout is finished. By turning this off, you can manually take steps (as specified by "step size") in the layout engine.
- Interactive mode: enable experimental interactive features in the diagram panel
- Grid size: increase or decrease the default grid size in "Diagram Variations."
Command-line interface: roger
roger is a command-line tool for generating diagrams from Penrose trios and serving local files to a local editor.
Installation
You can use roger without installation by:
npx @penrose/rogerOr install it globally:
npm i -g @penrose/rogerDiagram generation
roger trio can generate SVG from:
- A trio of
.substance,.style, and.domainfiles provided in any order. - A
.trio.jsonJSON file pointing to the trio, for example:
{
  "substance": "./tree.substance",
  "style": ["./euler.style"],
  "domain": "./setTheory.domain",
  "variation": "PlumvilleCapybara104"
}
Run roger trio --help to see more options.
roger can also generate multiple SVGs from a collection of Penrose trios. Run roger trios [trios..] to batch-generate from multiple trios.
Local development
See our contributor docs for how to use roger watch when developing Penrose locally.